Analysing and understanding your print operation has never been more important to your business, as David Pittman reports
Given the desire, nay need, to print profitably, analytics and business intelligence (BI) tools are in high demand. David Lowe, technical sales specialist at EFI, notes, ‘BI is crucial to any business, more so now than ever before. As the number of jobs or orders increase, keeping a firm grasp on the profitability and production efficiency impacts of varying run lengths, multiple print changes, and smaller orders becomes vital in maintaining a profitable and successful business.’
Nigel Tyler, research and development director at Optimus, opines that this has not been a priority for some printers in the current climate. ‘It has often been about how to survive in the immediate future, while data collection is geared towards strategic thinking, and long-term strategy tends to go out of the window when you’re living hand-to-mouth.’
Rather, he says, ‘Data is very useful for forecasting, and provides insights into how you are producing in the real-world versus estimating. It has been a non-issue but will become more important in the future.’
Know your knowledge
Workflowz managing director Alan Dixon posits that, ‘Knowledge is the new commodity,’ adding, ‘Using MIS
tools, you are able to take more insights out of your production environment, work out what is working and what processes are not as advantageous as they should be. This reveals areas of weakness and gives you the opportunity to improve.
‘You need to take this knowledge and make the best use of it to work out how you and your clients need to adapt. Why, how and what do you change, or do you stick with what you’ve got, and make incremental improvements but how and where?’
Imprint MIS sales director Peter Horwood affirms that printers are now looking to more deeply interrogate their data from across the production floor, and specifically to better assess the profitability and viability of various types of work. He adds that the reality of operating a business through the pandemic, where furlough has become a common occurrence and staff may have been required to self-isolate and stay away from the office, has required some to address their practices, and more importantly, assess what data they need to see, and how.
‘This past year has accelerated the inevitable in many ways. It has accelerated the change in how a lot of people communicate and made business visibility all the more important. Where you have had some people not onsite, and others wearing multiple hats and taking on new roles as a result, the importance of having the correct information to hand has been highlighted. A number of companies are taking part in business improvement conversations as a consequence, and are looking to maximise the data they can access and the information they can glean from their production via MIS.’
Mr Horwood adds that this has included a greater emphasis on investigating the volumes of data that already exist, and ensuring that it is correct and fit-for-purpose.
‘Critical to success is us consulting with the customer and finding out what they are looking to extract. We always go through the definition of what the customer wants, and then provide the means to create, generate and export the correct reports that are accurate and relevant to them. What is critical to one customer is not to the next, so it is essential that this part of the process is correct from the outset so you can be assured that the reports are relevant and reliable.’
To illustrate his point, Mr Horwood notes that the needs of a book printer will be different to that of a commercial digital printer, with the former likely to deploy multiple machines and processes, so looking to assess how much in sales has gone through each machine. For the digital printer, they are more likely to want to know how efficient their process is, and how quickly did the job go from order received to dispatch and was it as they expected.
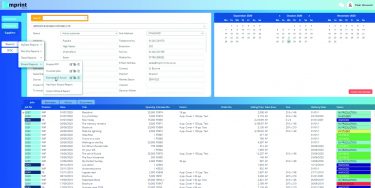
Imprint’s Dashboard Reporter uses Big Data to generate reports
Stephen Miller, director, product management, Kodak Workflow Software, says, ‘Analytics and BI help address such business challenges by using data to streamline workflows, maximise cost-efficiencies, and allow printers to push the boundaries of customisation with digital print. Adopting BI and ‘smart factory’ automation strategies can help printers adapt to evolving market demands and emerge from the crisis one step ahead of competitors.’
Mr Lowe adds, ‘The role of a good BI tool is to be able to take data and present it in a simple way, so that actions can be taken to address weaknesses or areas identified from the analysis. Processing and collecting the data and using it to predict various scenarios is where AI will take this step to the next level. It will give business leaders the power to evaluate various scenarios through collection of Big Data and transform it into actionable insights with a click of a button.’
Tools
EFI has developed a suite of BI tools, including its Productivity Workbench and widgets that offer highly visual ways to present key data from MIS to users and is built into the platform as part of the infrastructure. Traditional BI modules also support many of the EFI suites and utilise dashboard or data visualisation technology like QlikView or Kibana.
More recently, EFI has launched a new tool from the EFI Midmarket Print Suite. It comes with pre-configured layouts and has the the ability to fully customise visualisations within it, including using any user-defined fields that might be in the database, to increase the value of the analysis tools to the printer. A ‘wallboard’ view allows the chosen KPI to be displayed to the whole workforce.

Kodak’s Prinergy On Demand offers a host of analytics services
Kodak’s Prinergy Software has employed a Big Data approach from the outset. It is built on an Oracle database that constantly gathers data from jobs being prepared for production. The concept of an AI-powered workflow has been expanded with the Cloud-based Prinergy On Demand platform, which offers a variety of BI and decision analytics tools. These give printers easy access to trends and information about their operation that reveal opportunities to cut costs, streamline processes and reduce waste. Kodak cites as examples how printers can gain precise and detailed information on how much ink they’re using, how many jobs they’re processing and which types of jobs are the most profitable. ‘Printers can make more informed, better decisions about their operations,’ says Mr Miller.
Optimus Dataflex extracts data from Optimus MIS software in various formats and is used to send it to spreadsheets such as Excel for analysis, as well as to Cloud-based BI systems like Microsoft BI and Zoho Analytics.
Imprint’s MyData report generator reads directly from the database, with data and graphical reports running live with the option to create bespoke reports. A series of templates is provided, with users then able to alter, adapt, generate and filter their own reports. MyData works in real-time, so as jobs, estimates or customers change, so do the reports, providing staff with up-to-date information. Imprint’s Online Dashboard has a built-in report generator that can make SQL database inquiries, then filter those and assign them to specific people, helping address the need for greater remote access.
Kodak’s Prinergy On Demand offers a host of analytics services. These include job activity dashboards, which offer insights into production activities such as the utilisation of imposition templates across jobs and time. Once recurring manual steps are identified, these production processes can be automated. Ink and plate usage dashboards enable printers to estimate ink requirements for upcoming jobs, compare estimated ink usage to actual ink usage after a job has been completed, and look back at a history of ink estimations. Tracking and comparing ink usage allows users to refine ink usage factors for more accurate estimates. This in turn enables printers to better manage ink inventories and costs.
Prinergy On Demand further uses dashboards for the analysis of system processing actions, operator-initiated activity, software error or warning messages and the use of memory/disk storage. Activity dashboards present details associated with file storage, file transfer and operator-initiated activity such as tracking the number of times files/jobs are retrieved for plate remake and or corrections.
Heidelberg’s Prinect Smart BI features configurable and customisable dashboards, created using drag-and-drop functionality. These can be shared with team members and visualised in different ways to maximise analysis of the data. The Business module homes in on margins, incoming orders, deliveries and invoices, information that can be used to create business-related reports for managing sales and customer service, turnover, operating costs and margins. The Production module creates reports from production data – from prepress to finishing – supplying and processing data on planning and machine performance, utilisation, production quality, and overall equipment efficiency.
Simon Biddlecombe, Heidelberg’s Prinect project manager, Northern Europe, identifies the company’s Smart BI tool as a way to provide companies with a strategic overview and to help them plan for the future. Users can review scheduling data, colour data or any connected machine information, as well as track transition times between jobs, makereadies, washups and downtime. Users have full control of their own reports, from headline figures down to the finest detail. Smart BI is complemented by Analyse Point, which provides analysis of live shop floor data.
‘We are being asked to step in and help customers with analytics more and more now,’ says Mr Biddlecombe. ‘Our tools are there to help customers strategise, to steer their businesses and make the best use of their data.’
This he suggests can be used to benefit a company by allowing a printer to see how machines are being used, and to identify what and where more work is needed to maximise utilisation.
‘You can check running costs and margins, and see where the bottlenecks are. This helps you utilise everything you’ve got.’